I recently spent a lot of time trying to come up with an interactive data grid widget in Streamlit. It needed to be a bit like Excel: the value you enter in a cell should trigger the recomputation of the value in another cell. At first I assumed it would be relatively easy, but given the powerful state management model at the heart of Streamlit, I found out that it wasn’t. State management for UI programming remains a hard problem, no matter what is the environment. The most difficult aspect of React programming, for instance, is certainly state management. The user-driven asynchronous nature of a UI makes it an inherently difficult problem.
So I’m using the st.data_editor table widget, with the following requirements:
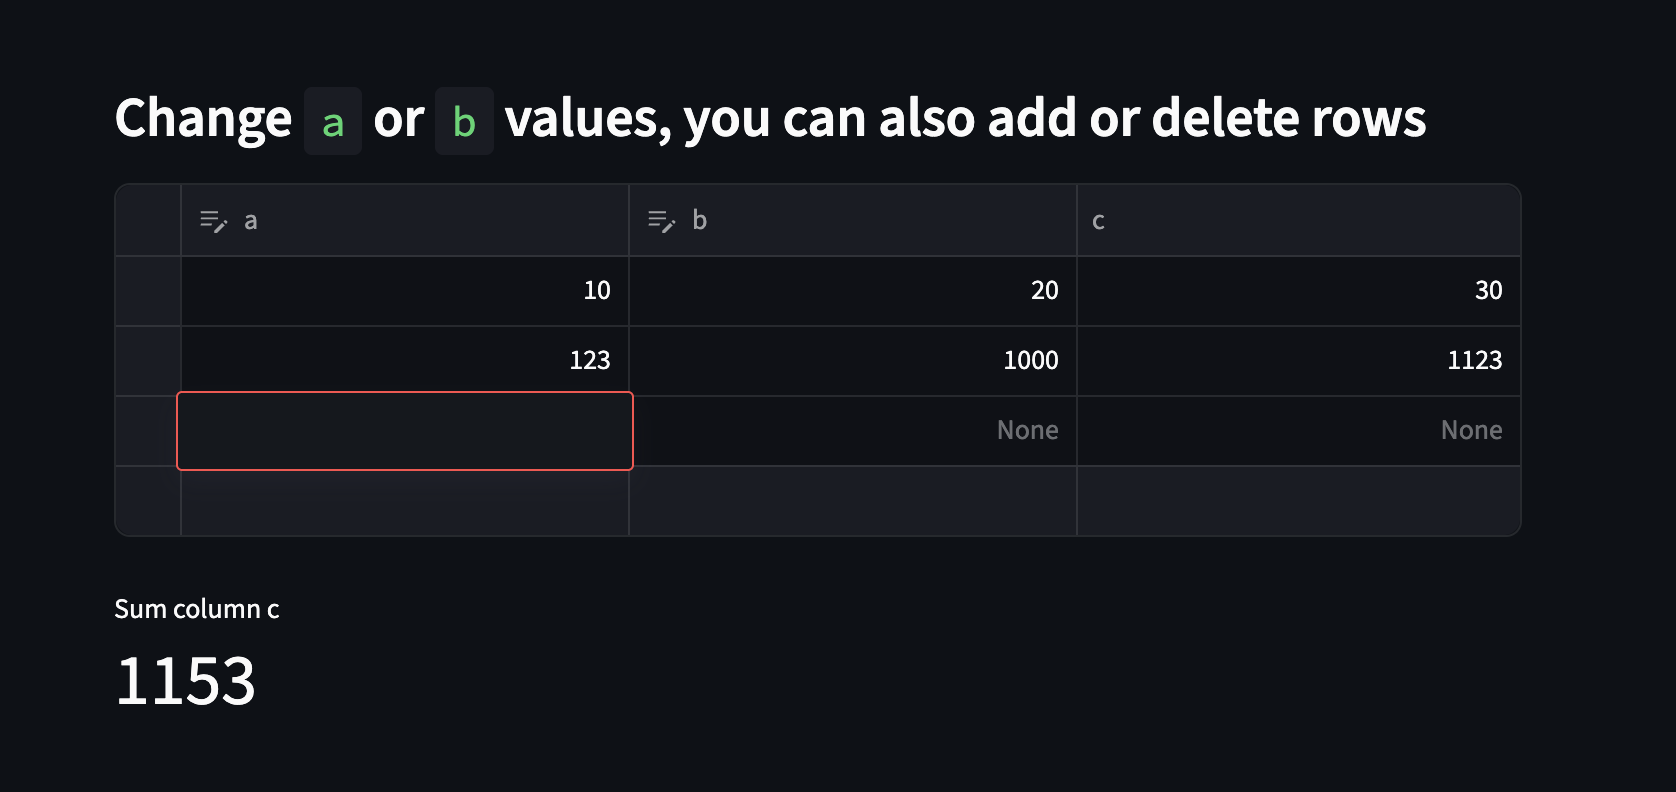
- Entering values in
aorbtriggers the computation of their sum inc(which is read-only) - You can add and delete rows
It looks like this:
First you should appreciate that this is quite a complex widget, which would require a lot of code in the context of a JS framework like Material UI (for React) or others, for instance. Streamlit’s powerfully simple programming model made it very enticing, and I was quite eager to make it work.
A nice thing about this widget is that you can use a pandas.DataFrame with it:
import pandas as pd
import streamlit as st

if "df" not in st.session_state:
    st.session_state.df = pd.DataFrame(
        [],
        columns=["a", "b", "c"],
    )
Next here is how you can define a table editor which feeds from the data frame:
st.data_editor(
    st.session_state.df,
    num_rows="dynamic",
    key="df_editor",
    disabled=["c"],
    on_change=handle_change,
)
The dynamic value for num_rows will make the table able to add and delete
rows, with its prebuilt UI. Also notice the on_change callback, which we will
talk about shortly. The tricky part is the state of the table, which is stored
in st.session.df_editor, as specified with the key. The state is stored in a
dict with this structure:
{
    'added_rows': [{'a': 123}],
    'deleted_rows': [1],
    'edited_rows': {2: {'b': 2}}
}
So if you want to react, using the on_change callback, every time there is a
change in the table, in order, for instance, to perform some calculation, you
might think that there is an easy way to get the entire data frame. But there
isn’t, so you need to rebuild it yourself, using your current version of the
data frame (which is not yet updated when the callback is called) and the
changes data structure:
def handle_change():
    changes = st.session_state["df_editor"]
    df = st.session_state.df.copy()

    for row_idx, updates in changes["edited_rows"].items():
        for col, new_val in updates.items():
            df.at[row_idx, col] = new_val

    # filter out placeholder/empty added rows
    new_rows = [r for r in changes["added_rows"] if r]

    if new_rows:
        df = pd.concat(
            [df, pd.DataFrame(new_rows, columns=df.columns)],  # keep schema
            ignore_index=True,
        )

    # apply deletions
    if changes["deleted_rows"]:
        df = df.drop(index=changes["deleted_rows"]).reset_index(drop=True)

    # perform the computation
    df["c"] = df["a"] + df["b"]

    # only update if needed
    did_change = bool(changes["edited_rows"] or new_rows or changes["deleted_rows"])
    if did_change:
        st.session_state.df = df
        st.session_state.sum = int(df.c.sum())